Metadata For Travel Adventures
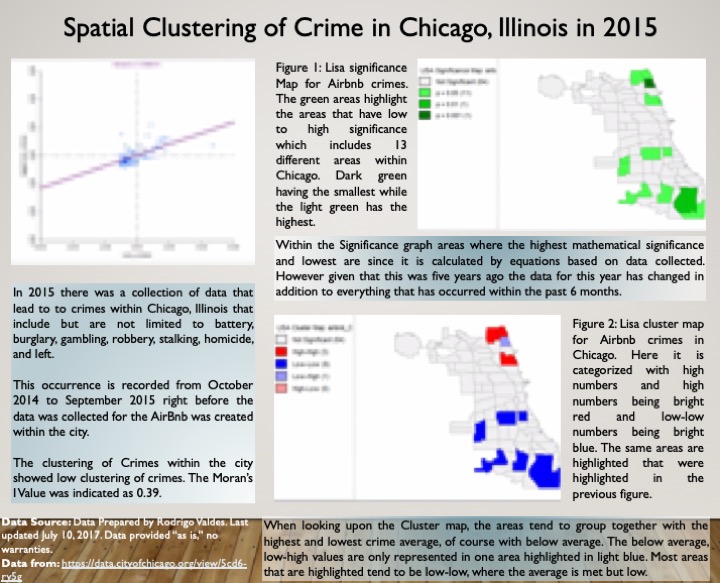
Crime Cluster
Interactive Map for R&D in 2007
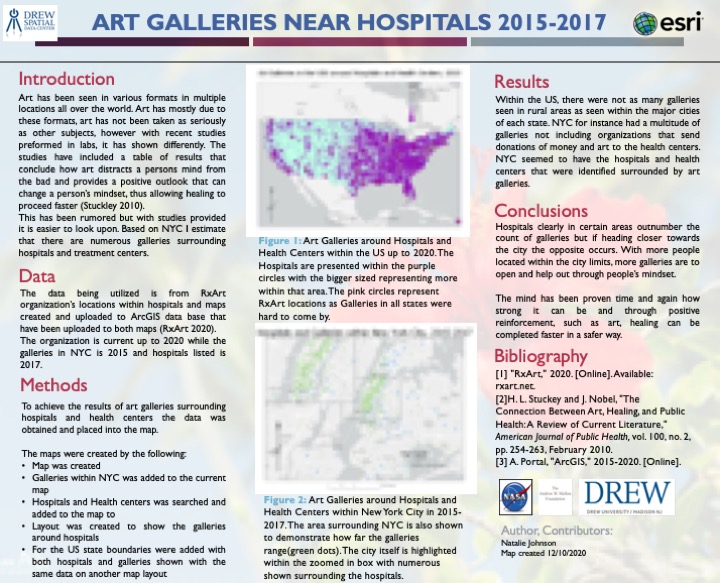
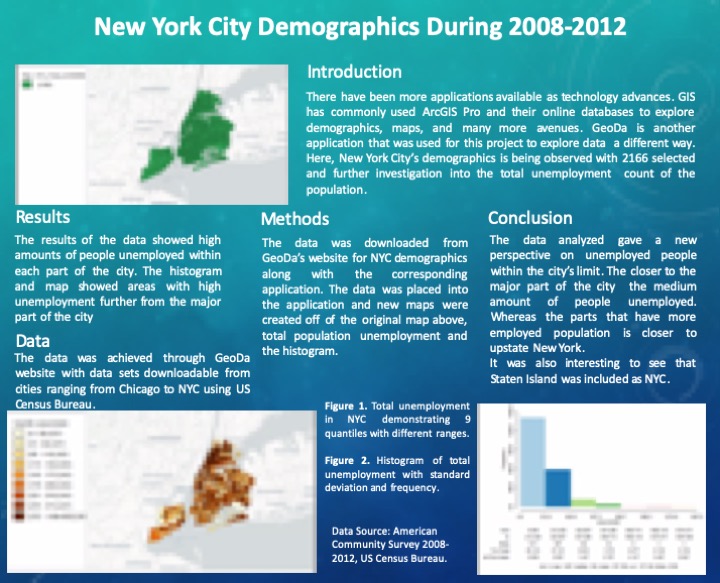
Research and development academic spending within the United States by state in 2007. The interactive map demonstrates the states (spending in millions) maximum, minimum, and the middle states. The states within the pink range have the spend not as much as those in purple but more than the states that are in blue. The blue states show the states that spend the minimum while the purple, singular state, California spends the most in an academic setting.
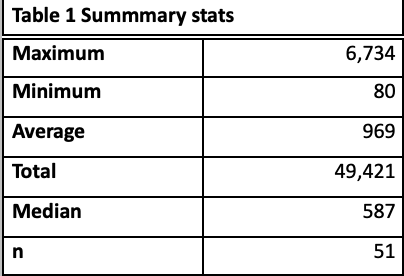
Table 1 summary stats has the values that are the min, max, and median from the provided data points. The n value demonstrate the count of observations, the number of states plus the District of Columbia.
R-Studio: Coding Maps
The code shown below allows maps to be created on open source applications such as R-studio. Population within the East Coast can be seen along with the 50 states of the country clearly outlined.
More Maps and Tables
Enhanced Model
Model Builder
3D Maps
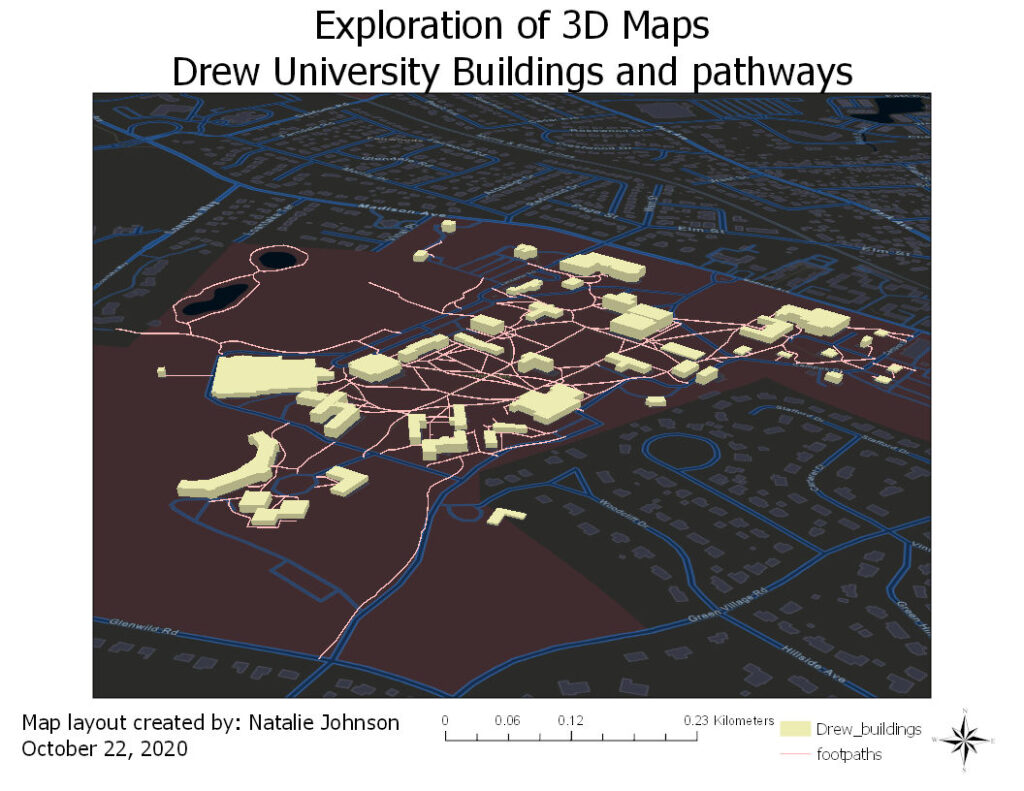
Maps have been known to demonstrate land over distances in a 2 dimensional array. However, now 3D images can be made of desired locations within maps, as seen in google maps on their satellite versions. Here, a map of Drew University can be seen with each building and pathway clearly seen and elevated to give the 3D effect.
Buffers
Buffers are not only used within chemistry and biology although it does mean something completely different when in a sentence with GIS. A buffer in GIS reclassifies information based on the distance from objects on types of vectors. Within this map, a buffer is used in correlation of farmland and known contaminated water sites. There are also intersecting areas where the water and farmland overlap from 2013.