Research and development academic spending within the United States by state in 2007. The interactive map demonstrates the states (spending in millions) maximum, minimum, and the middle states. The states within the pink range have the spend not as much as those in purple but more than the states that are in blue. The blue states show the states that spend the minimum while the purple, singular state, California spends the most in an academic setting.
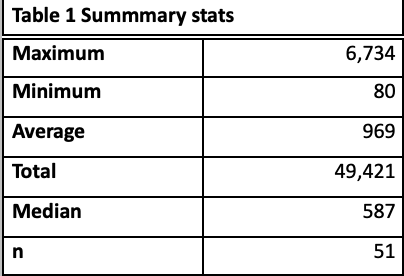
Table 1 summary stats has the values that are the min, max, and median from the provided data points. The n value demonstrate the count of observations, the number of states plus the District of Columbia.